Mutant information
AtMetExpress hormone database provides molecular phenotypes of 28 hormone mutants and 39 experiments with three biological replicates. All data was newly collected under strictly controlled growth condition for this database. ‘Mutant information’ shows the details of the experiments and gene and metabolite lists that significantly affected by the experiment (P-value < 0.05 in t-test and |log2 signal ratio (experiment/control)| > 0.6). The workflow of data collection and curation is here.
Compound
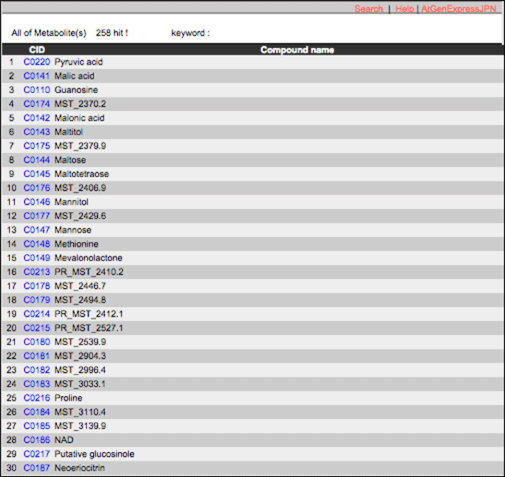
AtMetExpress hormone database contains 258 metabolites measured by four mass spectrometries. ‘Compound’ is an index of metabolites in AtMetExpress hormone database. The details can be seen from the link.

Gene and metabolite information
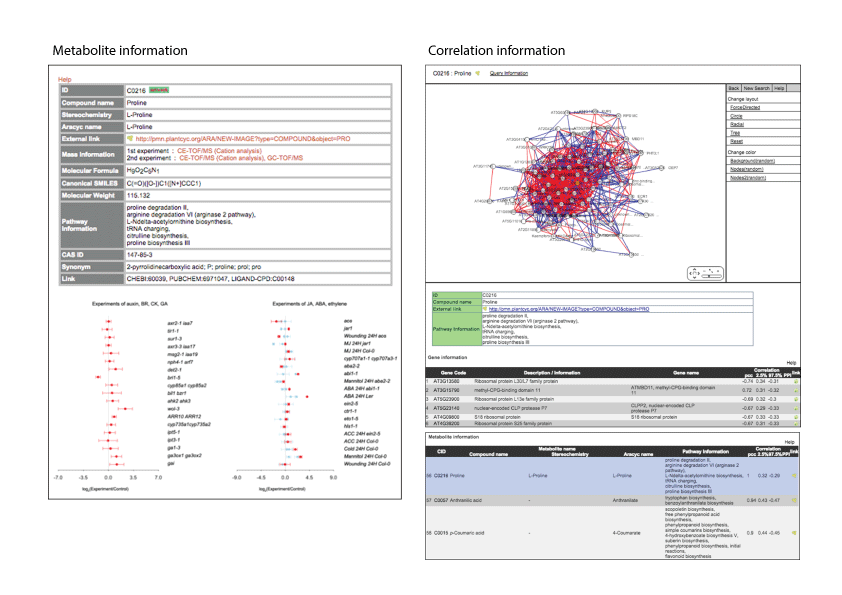
Each gene and metabolite page shows the brief annotation and the expression or accumulation levels across experiments. In the case that metabolites were detected by several mass spectrometries, plots in different color suggest values measured by different mass spectrometry. The primary value was plotted in red. Icon ‘network’ next to the ID is linked to a correlation network centering on the gene or metabolite (Pearson’s correlation coefficients).

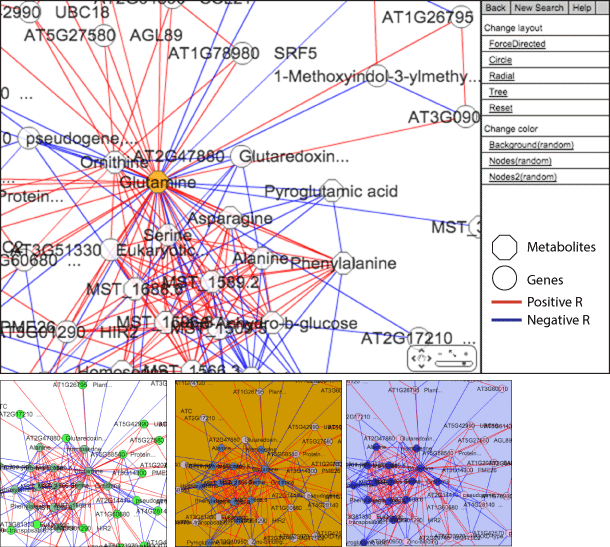
Enlarged view of the network panel and examples of the color variation
AtMetExpress hormone has used Cytoscape web (http://cytoscapeweb.cytoscape.org) to develop correlation networks. Although positive and negative correlation is red and blue lines respectively (|pearon’s R|>0.6) in the default networks, the network layout can be changed by the menu bar.

Gene and metabolite search
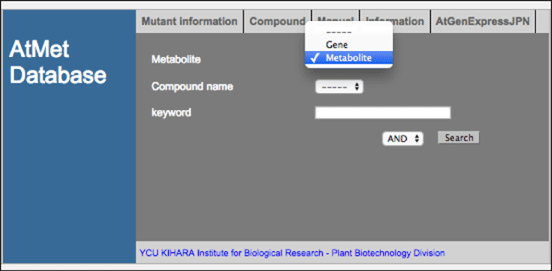
Before search, please select ‘Gene’ or ‘Metabolite’ from the drop-down menu. If you click search menu without inputting any name in the search box, you can get all entries in the AtMetExpress hormone database.
