3.1:Manual
How to use.
- Search public microarray experiments to analyze correlations to other data.
- How to read results.
- Analyzing your own data.
- 使い方マニュアル(日本語)
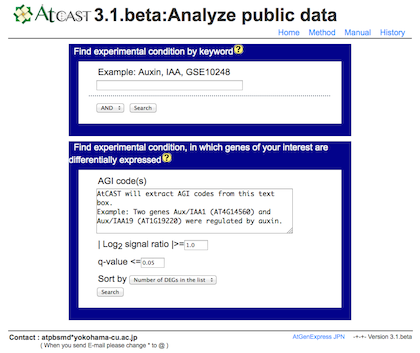
Search public microarray experiments to analyze correlations to other data.
a) Search experiments of your interest by keyword or differentially expressed genes.
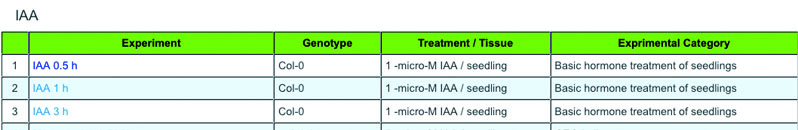
b) Select an experiment from the list. Click on an experiment name.
c) You will get the result.
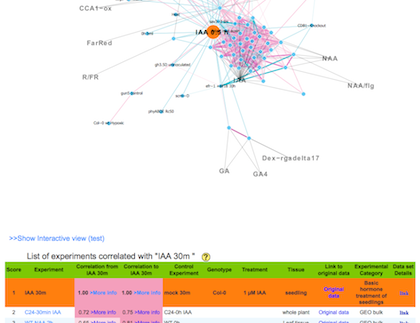
The result is consist of a network graph and a list of correlated experiments. If you click an experiment name on the list, you can jump to new network graph that is centered at the clicked experiment.
How to read result.
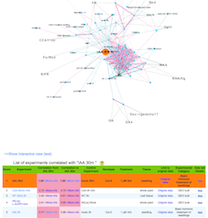
a) Relation map of gene expression profiles
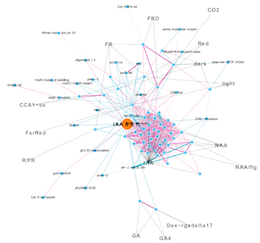

Node: Gene expression profiles
Edge: Relationship between nodes (Threshold)

Strong positive (one-way) correlation coefficient (≥ 0.7)

Strong negative (one-way) correlation coefficient (≤ -0.65)

Weak positive (both directions) correlation coefficient (≥ 0.5)

Weak negative (both directions) correlation coefficient (≤ -0.5)

Orange node indicates center experiment used as a query.
Gray edge and characters indicate experiment tags that are extracted as over-represented terms in experiment names.
b) A list of experiments correlated with a query experiment.
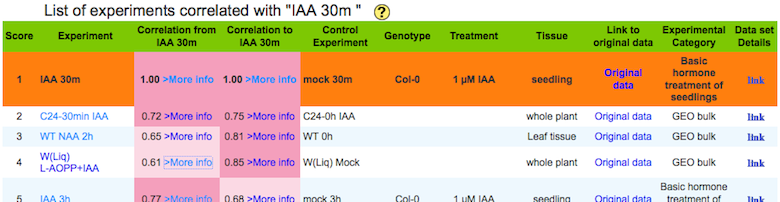
Score : The score indicates rank of correlation from the query experiment
Correlation
from :
Spearman's correlation between the center and the other experiment calculated by using module of the center (a query) experiment.
Correlation
to :
Spearman's correlation between the center and the other experiment calculated by using module of a experiment in each row.
Correlation
Data set Details: each botton links to basic statistics of the experiment and their replications.
c) Detail of correlation and trend of differentially expressed genes.
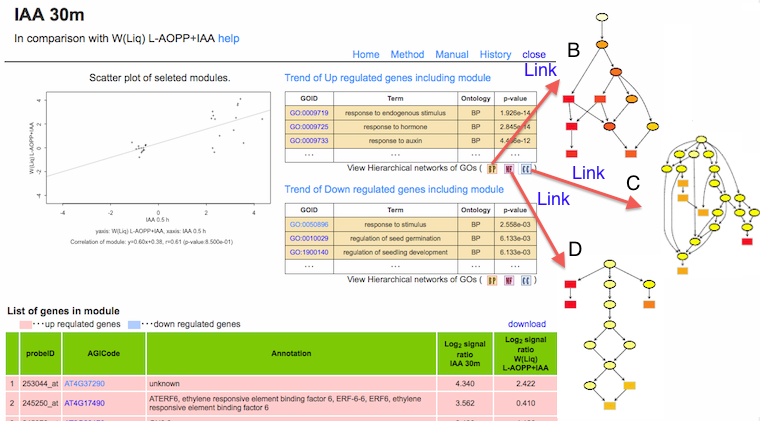
The scatter plot
:
Gene expressions of module (selected marker genes). Correlation between experiments is calculated using these genes.
Trend of Up or Down regulated genes
:
The result of GOE analysis. The Ontologies; Cellular component (CC, blue); Biological process (BP, orange); Molecular function (MF, pink) were analyzed. Full list of terms enriched are available through links at the titles of the tables. In the hierarchal view of GO terms (Links from buttons), colors represent the relative significance, ranging from red (most significant) to yellow (least significant).
List of genes in module
:
Gene expressions of genes included in the module sand used in MCN analysis. Up-regulated genes are marked with pink, while down-regulated genes are marked with blue.
d) Basic statistics of the experiments and their replications.
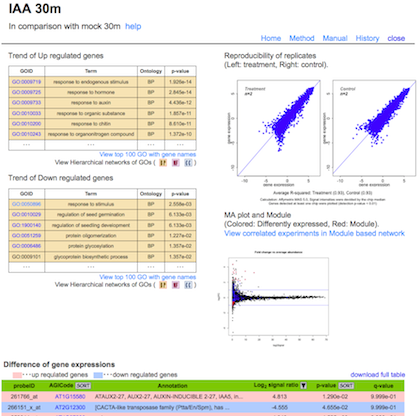
Trend of Up or Down regulated genes
:
The result of GOE analysis. The Ontologies; Cellular component (CC, blue); Biological process (BP, orange); Molecular function (MF, pink) were analyzed. Full list of terms enriched are available through links at the titles of the tables. In the hierarchal view of GO terms (Links from buttons), colors represent the relative significance, ranging from red (most significant) to yellow (least significant).
Scatter plot
:
Reproducibility of the biological replicates (Left: treatment, Right: control).
MA plot
:
Differential expression of genes. Vertical axis indicates fold change of signals between experiments. Horizontal axis indicates average signal in these experiments. Blue and red dots: significantly different (p-value < 0.05). Red dots: genes selected as module.
Difference of gene expressions
:
Results of student t-test for each probe sets are summarized in a table (p-value, q-value, ND indicates expression of the gene was not detected in significant level). Signal Ratio is indicated as log2 value (average signal intensity of treatment/average signal intensity of control).
e) Link from the main window.
*Experiment
*Link to original data
Link to sub-relationmap centered at the clicked experiment.
Link to information of microarray experiments.
You can get original Microarray data here.
You can get original Microarray data here.
Analysing your own data.
a) Data preparation
Format (Microarray data)
- Macroarray Chip: Affymetrix AG, ATH1, and Arabidopsis gene 1.1 ST array GeneChip
- Other macroarray data can be input using AGI code
- Number of Replicate Samples: more than 2 chips (Control data sets are required)
- See a sample of the data format.
Format (RNA-seq data)
- Number of Replicate Samples: more than 2 chips (Control data sets are required)
- See a sample of the data format.
b) File upload
To upload user data to the AtCAST database in a secure way, the website encrypts this session with self-signed certificate.
If you get warning message (as shown in the following screen shot), please confirm and click ‘continue to this website’button.
If you get warning message (as shown in the following screen shot), please confirm and click ‘continue to this website’button.
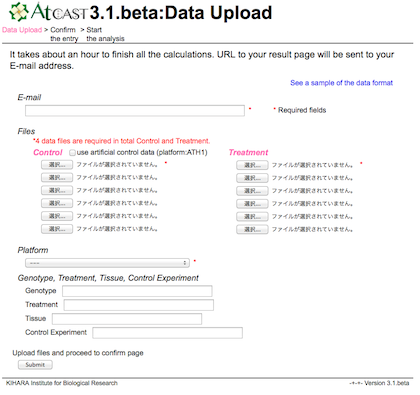
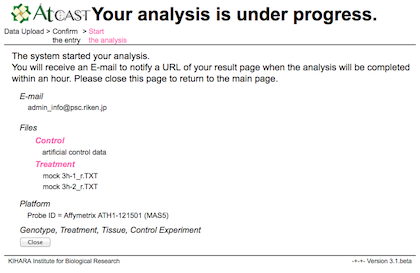
Enter your E-mail address and select your microarray data files.
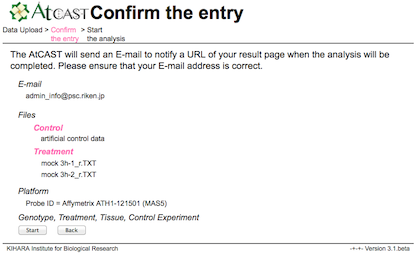
The AtCAST will send an E-mail to notify a URL of your result page when the analysis will be completed.
Please ensure that your E-mail address is correct.
Please ensure that your E-mail address is correct.
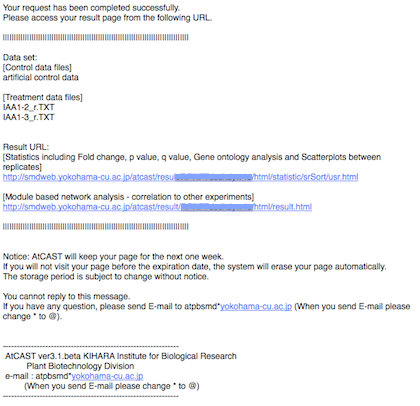
c) Result
After the analysis, URL of the user's own pages will be sent to the user by E-mail.
It usually takes several minutes per one analysis.
It usually takes several minutes per one analysis.